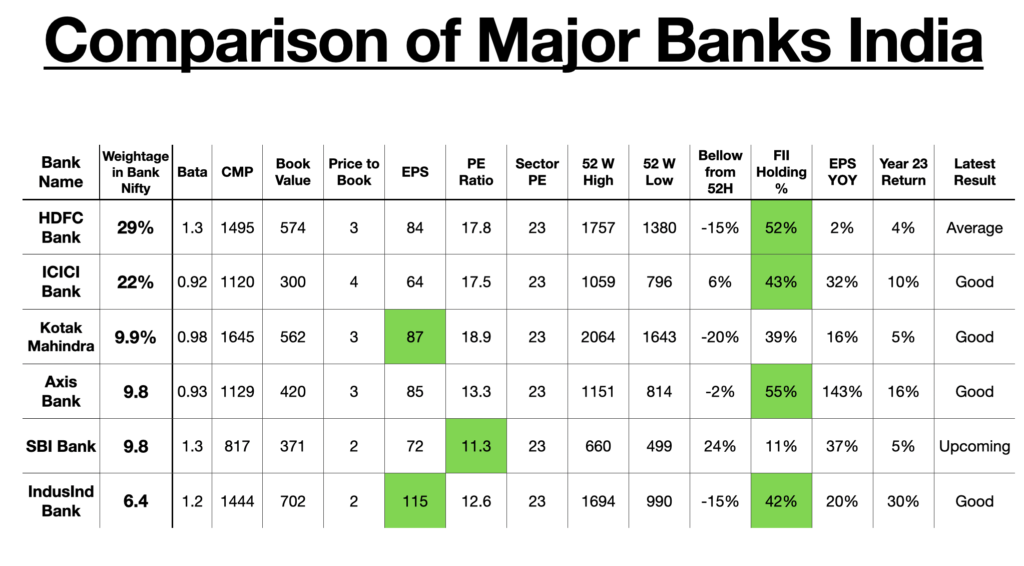
We have used following key metrics to compare these Big Banks of India.
- Weight in Index :- Weight in index is a term commonly used in the financial world to describe the significance or importance of a particular stock or asset in an index. An index is a collection of stocks or assets that are grouped together to represent a specific market or sector. Each stock or asset in the index is assigned a weight, which determines its influence on the overall performance of the index.
- Beta :- Beta is a measure of a stock’s volatility in relation to the overall market. It helps investors assess the level of risk associated with a particular stock. The beta coefficient is calculated by comparing the stock’s price movements with the movements of a benchmark index, such as the S&P 500.
- Book Value :- Book value is the net value of a company’s assets after subtracting its liabilities. It represents the value of a company’s equity and is calculated by dividing the total equity by the number of outstanding shares.
- Price to Book (P/B) Ratio :- The price to book ratio compares the market price of a stock to its book value per share. It is calculated by dividing the market price per share by the book value per share. A low P/B ratio may indicate that a stock is undervalued, while a high P/B ratio may suggest overvaluation.
- Earnings per share:- is a financial metric that indicates a company’s profitability. It is calculated by dividing the company’s net income by the number of outstanding shares. EPS provides insight into a company’s ability to generate profits for its shareholders.
- Price-Earnings (P/E) Ratio :- The price-earnings ratio is a valuation ratio that compares a company’s stock price to its earnings per share. It is calculated by dividing the market price per share by the EPS. A high P/E ratio may suggest that a stock is overvalued, while a low P/E ratio may indicate undervaluation.
- 52-Week High and Low :- The 52-week high and low refer to the highest and lowest prices at which a stock has traded over the past year. These levels can provide insights into a stock’s price volatility and its performance relative to its historical trading range.
- Foreign Institutional Investors (FII) Holding :- FII holding refers to the ownership stake held by foreign institutional investors in a company’s shares. It provides an indication of international investor sentiment towards a particular stock or market.
- Year-on-Year EPS Growth:- Year-on-year EPS growth measures the percentage increase or decrease in a company’s earnings per share compared to the same period in the previous year. It helps investors assess a company’s financial performance and growth potential.
We want you to understand these key metrics and then compare these Banks, as far as we are concern we can clearly see valuation difference even though earning is higher in some other bank where stock valuation is low.


+ There are no comments
Add yours